Saturday, June 22, 2013

Unit 4


On monday we continued to learn about unit 4 and projectile motion. The picture above is a great example of projectile motion. My friend is jumping off the pole and if I calculated the height of the pole from the water, and the speed she is moving at, I could figure out where she would land in the water. I could figure out this out by using dimensional kinetics which we have learned all about in this unit. In  types of problems we are using x and y distances, accelerations, times, velocities and original velocities.  It takes a lot of organization and the use of DAT, VAT & VAD. For most of these problems the X acceleration is 0 m/s2 and the Y original velocity is 0 m/s, but it really depends on the problem. 
Air Rocket Lab
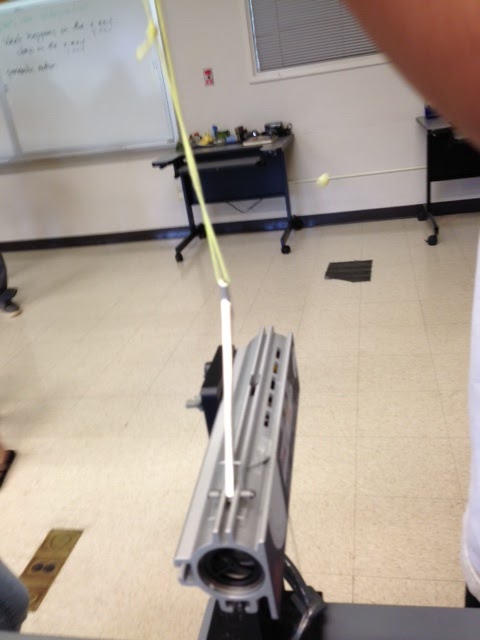
On monday we also played with rockets. Rockets are a great example of projectile motion. We shot up our rockets using 4 different caps and doing 3 trials per cap. Then we decided which cap was the most consistent. Using the times from the most consistent cap we figured out the average time and initial velocity. Mr. Blake gave us an angle that we would be firing with, we then used our angle and trig to figure out the distance that our rocket would land at. It took a lot of work, organization, and math but my group finally came up with a distance for where our rocket would land. When we went to test our distance, we were very wrong though. I think some errors in our experiment might have been organization, direction of wind, our gas pump and our white cap which was very broken. 

Thursday, June 20, 2013

Unit 4- Projectile Motion


Unit 4
In class today the most important rule that we learned was axes are independent. This rule turned out to be most helpful when we did problems including projectiles like the experiment in the left picture. Our experiment was to shoot a ball out of a projectile and try to be precise and accurate with the place that the ball hit the ground. We had to use the axes are independent rule when we had to figure out distances. We then were given a test height and using the velocity of the cannon that we had already calculated has to mathematically figure out where we should place the paper bulls eye. My group was pretty close when we tested out our distance, but we had a few errors like angles, the position of our projectile cannon and not using the same ball every time.  It was a really fun activity.

We also did a fun pool activity today. A few of my classmates jumped in the pool and we video taped them doing it. Then we took the video and put it up in logger pro. In logger pro we graphed the persons acceleration, velocity and position and it was really interesting to see how the person moved. 

Wednesday, June 19, 2013

1st Quarter Review

Today:
In class today for our lab practical we dropped a thin plastic sheet through a motion detector and examined it's  position vs. time and velocity vs. time graphs. The relationship of the position vs. time graph was squared and the relationship of the velocity vs. time graph was linear. We learned about this yesterday and that a curved position vs. time graphs gives you a linear velocity vs. time graph and acceleration. 


These two pictures of people running is a good example of what we have been learning this first quarter. We learned all about speed, velocity, distance, acceleration and movement. If I wanted too I could graph all of these runners using the great knowledge that I have learned this quarter. 
Unit 1 
In unit 1 we learned about: 
Accuracy- closeness
Precision-consistency 
Qualitative- qualities measurements
Quantitative- numbers measurements
We learned about the 5 different graph shapes no relationship, direct, inverse, exponential, square root and all of their mathematical equations. 
Kilo=1000 Centi=.01 Mili-.001
D= V/ T
Unit 2
In unit 2 we learned about:
Scalar (a number that has magnitude)- distance & speed 
Vector (has magnitude and direction)- displacement and velocity 
Velocity-average speed
Graphing Rules
1. The slope of a position vs. time graph is velocity 
2. The slope of a velocity vs. time graph is acceleration
3. The area under the "curve" of a velocity vs. time graph is distance.

We learned how to tell on graphs when two objects are moving which object is moving faster and which object has moved further. You can figure these out by if which slope is steeper, and which is longer on the x axis. When the lines of a position vs. time graph is direct, then the line of a velocity vs. time graph is a straight horizontal line. 
Unit 3 
In unit 3 we learned about:
A= V/T  Units: m/s2
Curved position vs. time graphs give you acceleration
DAT, VAT, & VAD
We learned how to do kinematics equations and which steps to follow: Write down the question, write down givens, sketch, choose equation, plug in and box your answer. 
We went over lots of graphs having to do with velocity and acceleration. We learned how to go from a position vs. time graph to a velocity vs. time graph to a acceleration vs. time graph. 


Tuesday, June 18, 2013

Unit 3


These two photos show a glimpse of what we did in class today. The focus of our class was on acceleration and using acceleration in real life situations. One of the real life situations that we experimented with is the one shown in the pictures above which is dropping two different sized balls. The question that was asked when we dropped these two balls was would the large ball be faster, would the small ball be faster, or would they be the same. We soon found out that they were of the same speed, even though one ball was significantly larger. 
We also went over multiple kinematics questions and I were tested on challenging problems. By using DAT, VAT, & VAD we were able to complete these problems. I found out that drawing a diagram is very helpful. I learned that for most problems the key is acceleration, as for DAT, VAT, & VAD acceleration is something you always need to know to figure out another variable. I also learned that in most problems acceleration is 9.8 or 10 m/s2 down . This is the acceleration for anything while on earth. 
Graphing:  We graphed cars going down ramps, and graphed balls being thrown up in the air. 
From these graphing exercises I learned that going up a slope means the object is slowing down, going down a slope means the object is speeding up. When a ball is thrown up it's acceleration is fast, but then slows and stops at the top, then goes down faster until it stops in someones hands. 

Extra Credit: Teaching my parent


Monday, June 17, 2013

Unit 3- Uniform Acceleration


As a carousel starts to spin it gradually picks up speed, or accelerates. 

Acceleration= a change in velocity per unit of time 
A= V/ T Units= m/ (s)2

In Unit 3 we learned a lot about acceleration. I could graph the position, velocity, time and acceleration of a carousel. 
We also learned a few equations that can help us to figure out distance, acceleration, time, or velocity. 

Equations: 
d= 1/2(a)(t)2 + (Vo)(t)
v=Vo + (a)(t)
(v)2=(Vo)2 + 2ad 

We also learned steps to help us use these 3 equations

1. Write down the question
2. Write down the givens
3. Make a sketch. 
4. Choose the equation. 
5. Plug in
6. Box answer
7. Check to make sure your answer makes sense. 

All of this information will help if you ever needed to figure out the velocity that the carousel is moving out, the distance that one of the moving animals has traveled, the acceleration the carousel has picked up, or the time that it took for the carousel to go around. 


Today we conducted a experiment using skateboards. We conducted 2 trials on 2 different types of moving objects, a skateboard and a "danger" board. We timed each 5 meters as the boards passed and then graphed the results.  By looking at the graph we noticed that acceleration increased as the skateboard's distance increased down the slanted surface. 
From the results we also figured out one graphing rule: curved position vs. time graphs give you acceleration. 


Friday, June 14, 2013

Unit 2-Kinetics


My picture relates to what we learned in unit 2 because we learned about motion. When people snowboard or ski they are in motion. Going down the slope their velocity or average speed changes as well as their distance and displacement. 

Snowboarders and skiers accelerate as they move down the mountains. 
Acceleration- a change in velocity per unit of time, any time you change your velocity . You can find the acceleration of a moving object by using the formula: A= V/ T

Snowboarders and skiers move quickly down mountains, sometimes skiers are faster some times snowboarders are faster. You can figure out the speed and position of skiers and snowboarders at different times by using graphing and equations. 

The slope of a position vs. time graph is velocity. Position vs. time graph tell you where you are (position.)
The slope of a velocity vs. time graph is acceleration. This type of graph tells you velocity. 

 This information could be helpful when you need to know where a skier or a snowboarder was at a certain time. If the snowboarder has a velocity of 30 mph and the skier has a velocity of 35 mph then you can conclude that the skier is quicker. On a graph the skiers slope will be steeper. 

The area under the curve of a velocity vs. time graph is distance traveled (displacement). If you look at a velocity vs. time graph you can figure out the displacement of a moving object without using an equation.